July 16th, 2025
New
Improved
Release 2025.07.16
We're thrilled to introduce a suite of powerful new tools on the Portfolio page, under the Allocation tab, designed to give you an even deeper understanding of your investment diversification.
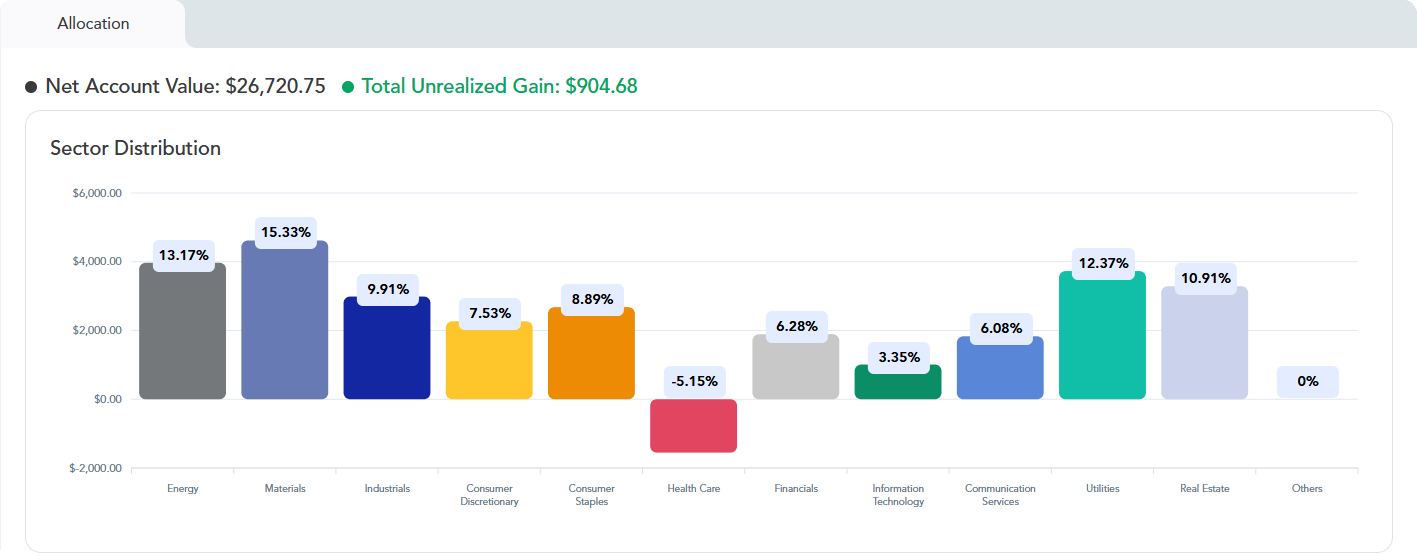
Portfolio Allocation: Sector Distribution
What: This new visual tool displays the current market value and percentage allocation of your portfolio across 11 distinct market sectors and an "Others" category. Each bar dynamically updates as your holdings and market values change.
Why: This provides you with a quick, at-a-glance overview of how your capital is distributed across major sectors. It's a powerful way to immediately assess your broad diversification and identify potential concentrations.
Portfolio Allocation: Sector & Industry Group Hierarchy

What: A dynamic visualization offering two levels of detail:
The default Sector Level shows "boxes" sized by your percentage ownership, including the current value and benchmark comparisons.
You can then drill down into the Industry Group Level by clicking on a sector to see the specific industry groups you own within that chosen sector.
Why: This interactive treemap allows you to visualize your diversification with both broad and granular perspectives. You can quickly spot significant allocations and dive into the specifics, helping you understand where your investments truly lie within the market structure.
Portfolio Allocation: Detailed Holdings Table

What: This is a detailed, hierarchical table displaying all your individual stocks, expertly categorized by Sector and Industry Group. It includes columns for quantity, current value, percentage of your total portfolio, and allows you to expand and collapse categories for customized detail.
Why: For those who prefer a numerical breakdown, this table offers ultimate control. You can explore your portfolio's composition at any level of detail, from a high-level sector view down to individual stock holdings, ensuring complete transparency and precise analysis.
Enhancements ⬆️
Profile View Enhancements
What: We've removed the Data Protection, Privacy Policy, and Terms of Service pages from your profile view to streamline your navigation.
Why: These important legal and informational pages are still easily accessible in the footer of our website. By removing them from the immediate profile view, we've created a cleaner, less cluttered experience, making it easier for you to manage your core account and application settings.
Unrounded Profit Calculations
What: We've updated the formatting of the Cumulative Profit and Profit by Month graphs to no longer round values. You'll now see the precise figures for your profits and losses.
Why: Precision matters when it comes to your financial data. By displaying unrounded values, we're providing you with the exact profitability of your trades, enabling more accurate analysis and a clearer understanding of your performance.
Date Range Selector Update
What: We've added a "3M" (Last 3 Months) option to the Date Range Selector and removed the "All" option.
Why: We've optimized the common date range selections. The "3M" option provides a popular short-term view, while removing "All" helps us ensure optimal performance for your dashboard by focusing on more frequently used periods.