August 29th, 2025
New
Release 2025.08.29
Dive deeper into your dividend strategy! We've launched a brand-new Dividend Income tab on the Portfolio page. It features powerful new tools designed to provide you with a clearer view of your dividend earnings and future income estimates.
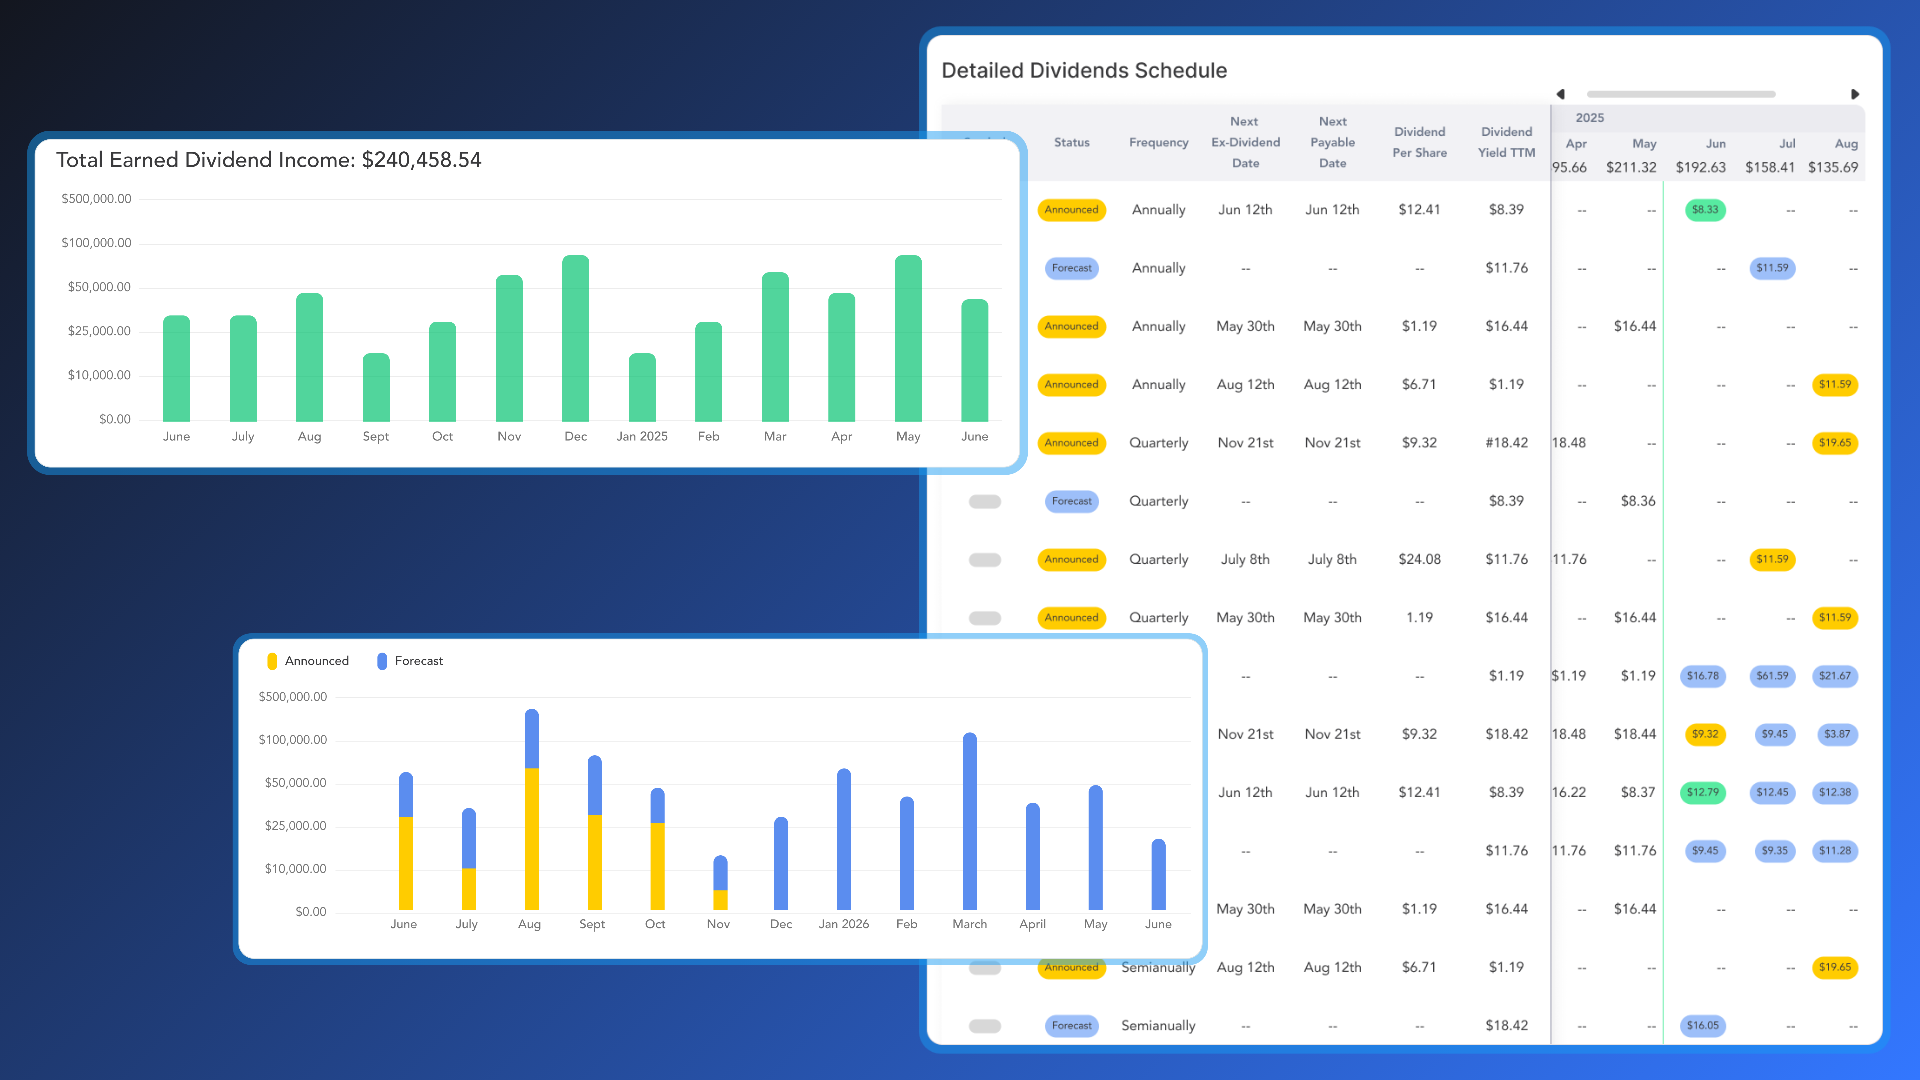
Total Earned Dividend Income

What: This new graph provides a clear and intuitive view of your historical dividend earnings. It displays the total sum of all dividends you have earned to date and breaks down your income month-by-month. The graph is horizontally scrollable, allowing you to easily view your entire dividend history.
Why: You can now instantly see how much total dividend income you've earned and visualize the growth of your earnings over time.
New Dividend Summary Cards

What: We've introduced four new dividend cards to help you analyze your dividend income:
Trailing Twelve Months (TTM) Dividend Growth Rate: A card that provides a dynamic, real-time percentage comparison of your dividend income over the most recent 12-month period versus the prior 12-month period.
Total Estimated Income: A card that shows the combined sum of all your announced and forecast dividend income for a selected future date range.
Announced Income: A card that displays the total of your officially declared dividend income for a selected future period.
Forecast Income: A card that shows the total of your estimated future dividend income.
Why: These new tools provide valuable insights into your dividend performance and help you easily track confirmed payments, anticipate potential earnings, and assess the growth momentum of your income stream.
Estimated Dividend Income Date Range Selector
What: We've added a new date range selector to the dashboard, which allows you to filter and view your estimated, announced, and forecasted dividend income for upcoming periods. It includes predefined options like 1M, 2M, 3M, and 6M, as well as a custom range selector that only allows you to select future dates.
Why: This new tool gives you the flexibility to easily analyze your dividend projections for specific timeframes, helping you to plan for future cash flow with greater precision.
Estimated Monthly Income

What: This is a dynamic chart that shows you a month-by-month breakdown of your future dividend cash flow. Each bar is separated into "Announced" dividends (officially declared income) and "Forecast" dividends (estimated income). The graph starts with the next calendar month and extends to the following year, automatically updating as time passes.
Why: You can now easily visualize your estimated future cash flow, allowing you to plan ahead with confidence. The stacked view helps you differentiate between confirmed and projected earnings at a glance.
Detailed Dividend Schedule

What: This new, Detailed Dividends Schedule table is a comprehensive tool for tracking and planning your dividend income. It is split into two sections:
The Left Side provides a summary of each dividend-paying stock, including its status (Announced or Forecast), frequency, and key dates. This section remains frozen as you scroll.
The Right Side is a horizontally scrollable schedule of your monthly dividend payments. It shows the total monthly dividend from all your stocks and color-codes each individual payment to indicate if it is Earned, Announced, or Forecasted.
Why: This powerful table provides a complete view of your dividend-paying holdings in one place, from summary details to a detailed, interactive timeline of your payments. You can effortlessly track the status of upcoming dividends and analyze your income stream.