April 16th, 2026
New
Improved
Release 2026.04.16
Enhancing Your Analytical Workflow: Personalized & Customizable Dashboard
This update represents the next phase of how you interact with your financial data within Orizon.
We have transitioned from static summaries to a Modular Customizable Framework, designed to provide a personalized experience that aligns with your specific monitoring and analytical objectives.
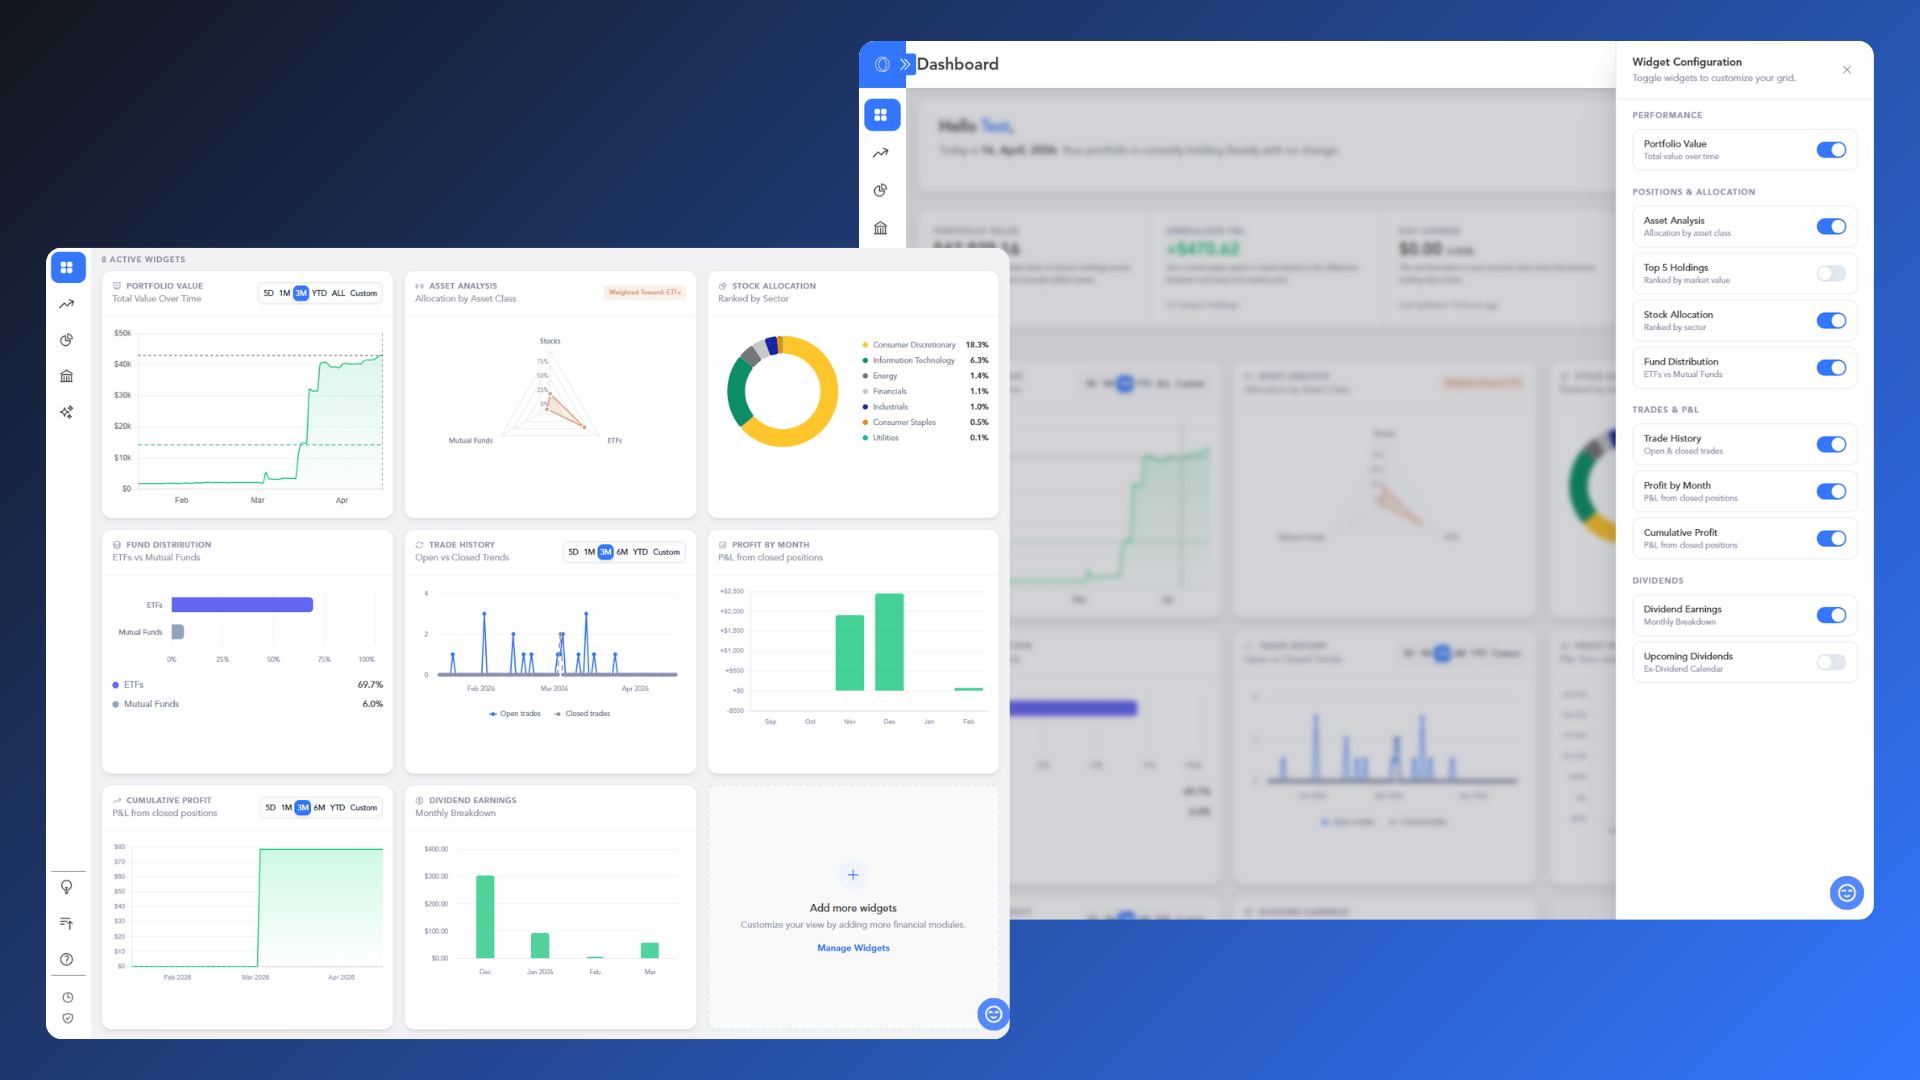
The New Modular Customizable Framework
What: A transition from a fixed overview to a customizable, component-based analytical dashboard.
Why: To ensure your dashboard reflects your unique priorities. Whether you are focused on identifying daily market movements, tracking passive income growth, or evaluating sector concentration, this flexibility allows you to highlight the data that is most relevant to your current strategy.
Personalization & Control via Configuration Slide-Out
What: An on-demand menu for toggling analytical modules in real-time.
Why: To allow for seamless adjustments without losing your place. By visualizing layout changes as they happen, you can efficiently curate your workspace to match your focus for the day, with the confidence that your settings will persist between sessions.
The Widget Gallery: This expanded suite of analytical tools is designed to provide specific clarity based on your monitoring style:
Portfolio Value: Gain perspective on your long-term wealth journey with a comprehensive historical equity curve.
Asset Analysis: Identify structural balance across Stocks, ETFs, and Mutual Funds at a glance using radar visualization.
Top 5 Holdings: Quickly monitor your largest financial exposures to manage concentration risk effectively.
Stock Allocation: Visualize sector diversification to ensure your equity strategy remains aligned with your risk tolerance.
Fund Distribution: Evaluate the weight of your indirect investments to better understand your core portfolio strategy.
Trade History: Review your trading velocity to determine if you are in an accumulation or consolidation phase.
Profit by Month & Cumulative Profit: Contextualize your realized performance over both short-term and long-term horizons.
Dividend Earnings & Upcoming Dividends: Monitor historical income trends and estimate potential cash flow for better liquidity planning.
Direct Insights with Echo AI
What: Integration between your dashboard metrics and the Echo AI Assistant.
Why: To move from data collection to data interpretation efficiently. Instead of manually cross-referencing charts, you can ask Echo to:
“Identify today's top performers.”
“Compare quarterly dividend growth."
This allows you to receive narrative overviews that assist in contextualizing your portfolio’s evolution through natural conversation.
General Disclosures for Product Updates
This Release Updates page is an advertisement of Orizon Analytics, LLC ("Orizon"), an SEC-registered investment adviser. Registration does not imply a certain level of skill or training.
Nature of the Service: Orizon provides non-discretionary portfolio analytics and investment recommendations. We do not provide financial planning, tax advice, or discretionary management. All investments carry risks, including the potential loss of principal. The Echo AI Agent is an analytical tool and does not possess the capacity to consider a client's individual financial situation or risk tolerance; users should not rely solely on AI-generated outputs for investment decisions.
Hypothetical & Illustrative Data: Any charts, graphs, or "Snapshot" values shown are for illustrative purposes only.
General Disclaimer: The information provided here is not intended to be personalized investment advice. Any discussion of potential benefits from using our features must be weighed against the material risks of investing in securities. Past performance is not a guarantee of future results. For full details on our services, fees, and conflicts of interest, please consult our Form ADV Part 2A Brochure and Form CRS available on our website.